- 中学校
中学授業 中2数学 「二十歳になる時の長崎県の平均気温を予測しよう。」
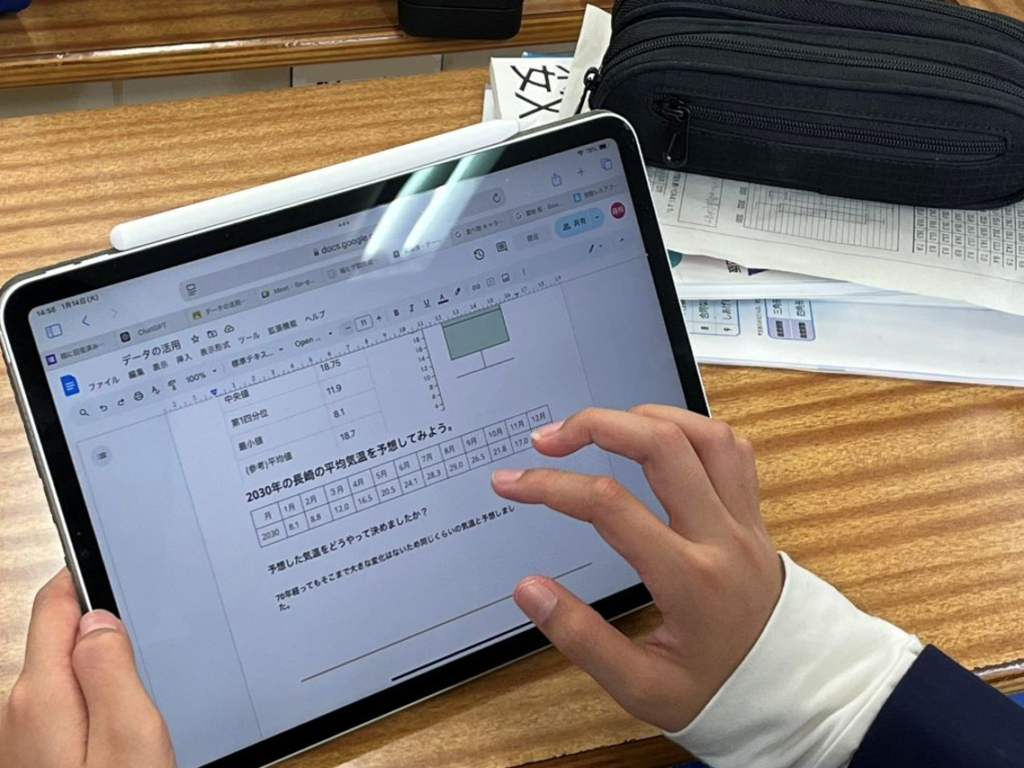
中2数学 「二十歳になる時の長崎県の平均気温を予測しよう。」
テーマ
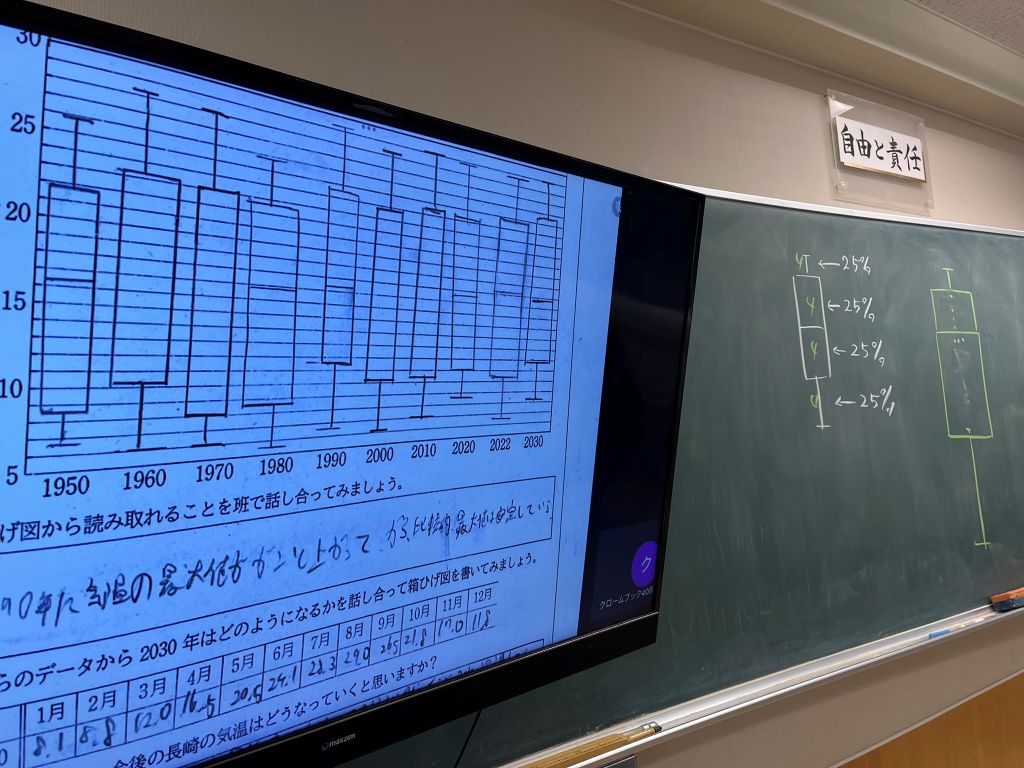
「 長崎県の平均気温のデータを1950年から10年ごとに箱ひげ図で表し
君たちが20歳になる2030年の長崎県の平均気温を予測して,
自分の考えを発表しよう。」
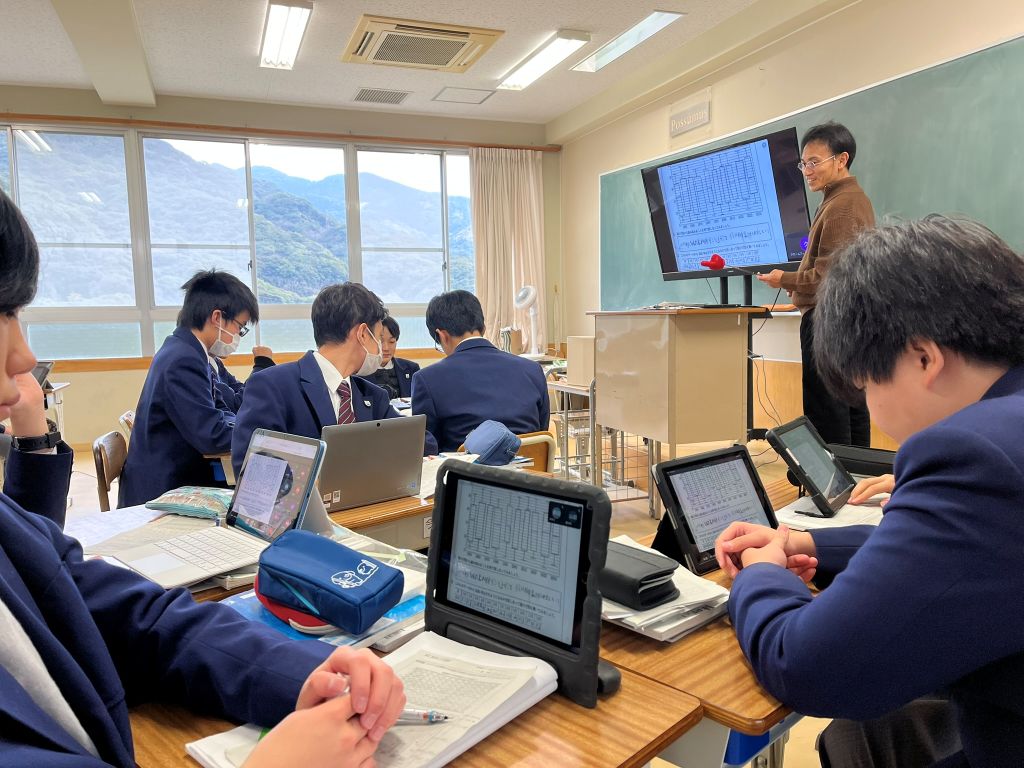
この授業では「箱ひげ図でデータを分析し,予測を立てる」ことを身につけることが目標です。
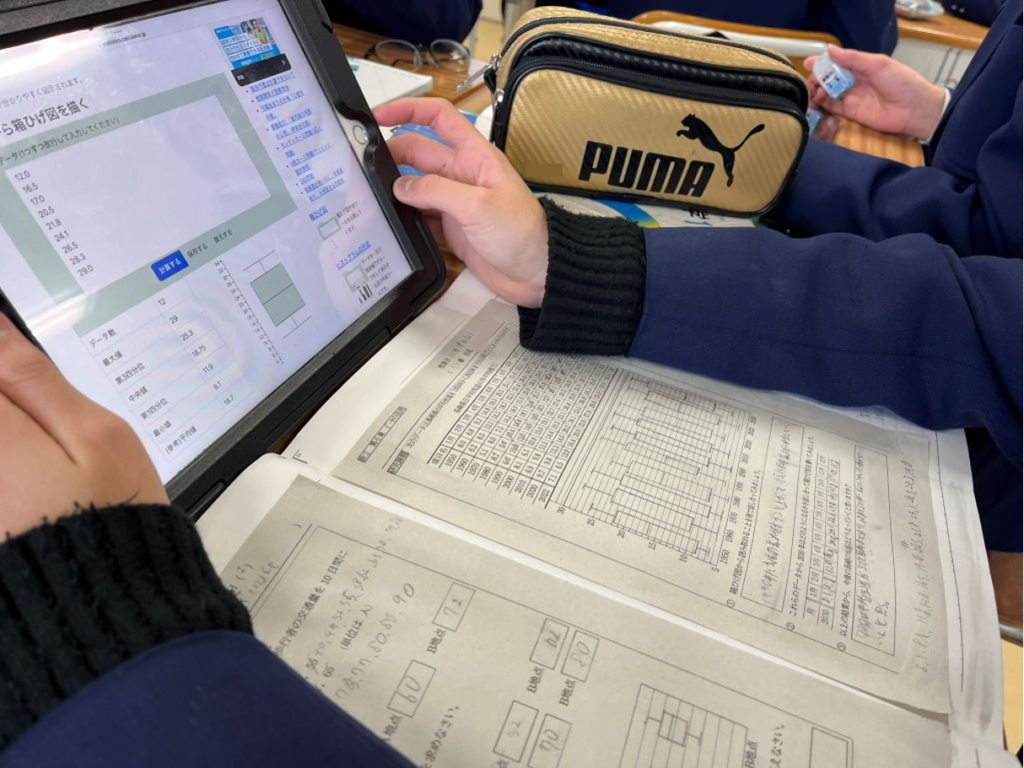
まず手書きで箱ひげ図を書いた後、班での予測を発表します。
箱ひげ図はそれぞれの区分が25%ずつになっているそうです。今の中学数学ではデータの分析も学習内容です!
より正確な図とするために、箱ひげ図が作成できるウェブサイトにデータ入力して作成します。
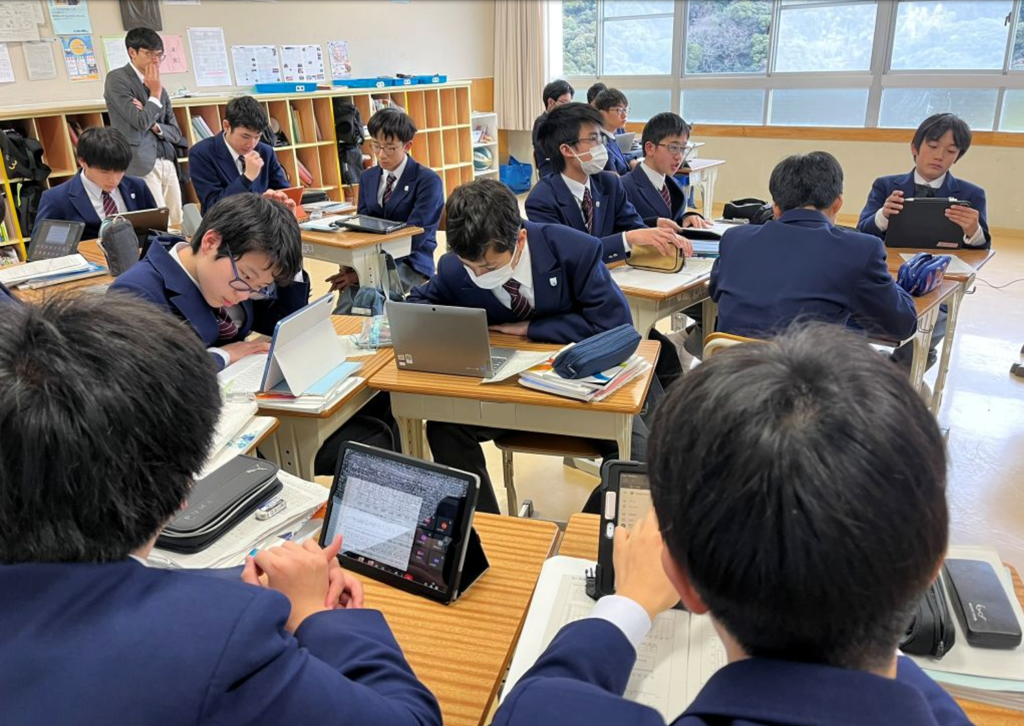
生徒たちは作成サイトがあることにびっくり!
端末を使い、データの処理から未来の予測をした生徒たち、個人の振り返りを書いてまとめました。